- Navigate to Portal → Analytics from your left navigation pane (only users with Manager or Owner role can access the Portal Analytics page).
- Navigate within your Analytics page using the 3 buttons at the top of the Analytics page

- Academy Insights
- Top Section: Courses Started, Completed, & Completion %
- This shows aggregate data across all courses on your portal.
- Courses Started: total number of courses that have been started, but not completed, on your portal.
- Courses Completed: total number of courses completed across all courses on your portal.
- Completion %: This is the completion percentage of all courses that were started on your portal (Courses Completed divided by Courses Started).

- This shows aggregate data across all courses on your portal.
- Bottom Section: By-course data
- This section shows Started, Completed, & Completion % for each course. You can also see the average Rating given by your users for each course.

- This section shows Started, Completed, & Completion % for each course. You can also see the average Rating given by your users for each course.
- Top Section: Courses Started, Completed, & Completion %
- Engagement Insights
- All Users: shows the current aggregate total users on your portal with a further breakdown by role and the total percentage of users by role.
- Note: because a single user can hold more than one role, the sum of users by role, and user percentage by role may exceed the total user count.

- Note: because a single user can hold more than one role, the sum of users by role, and user percentage by role may exceed the total user count.
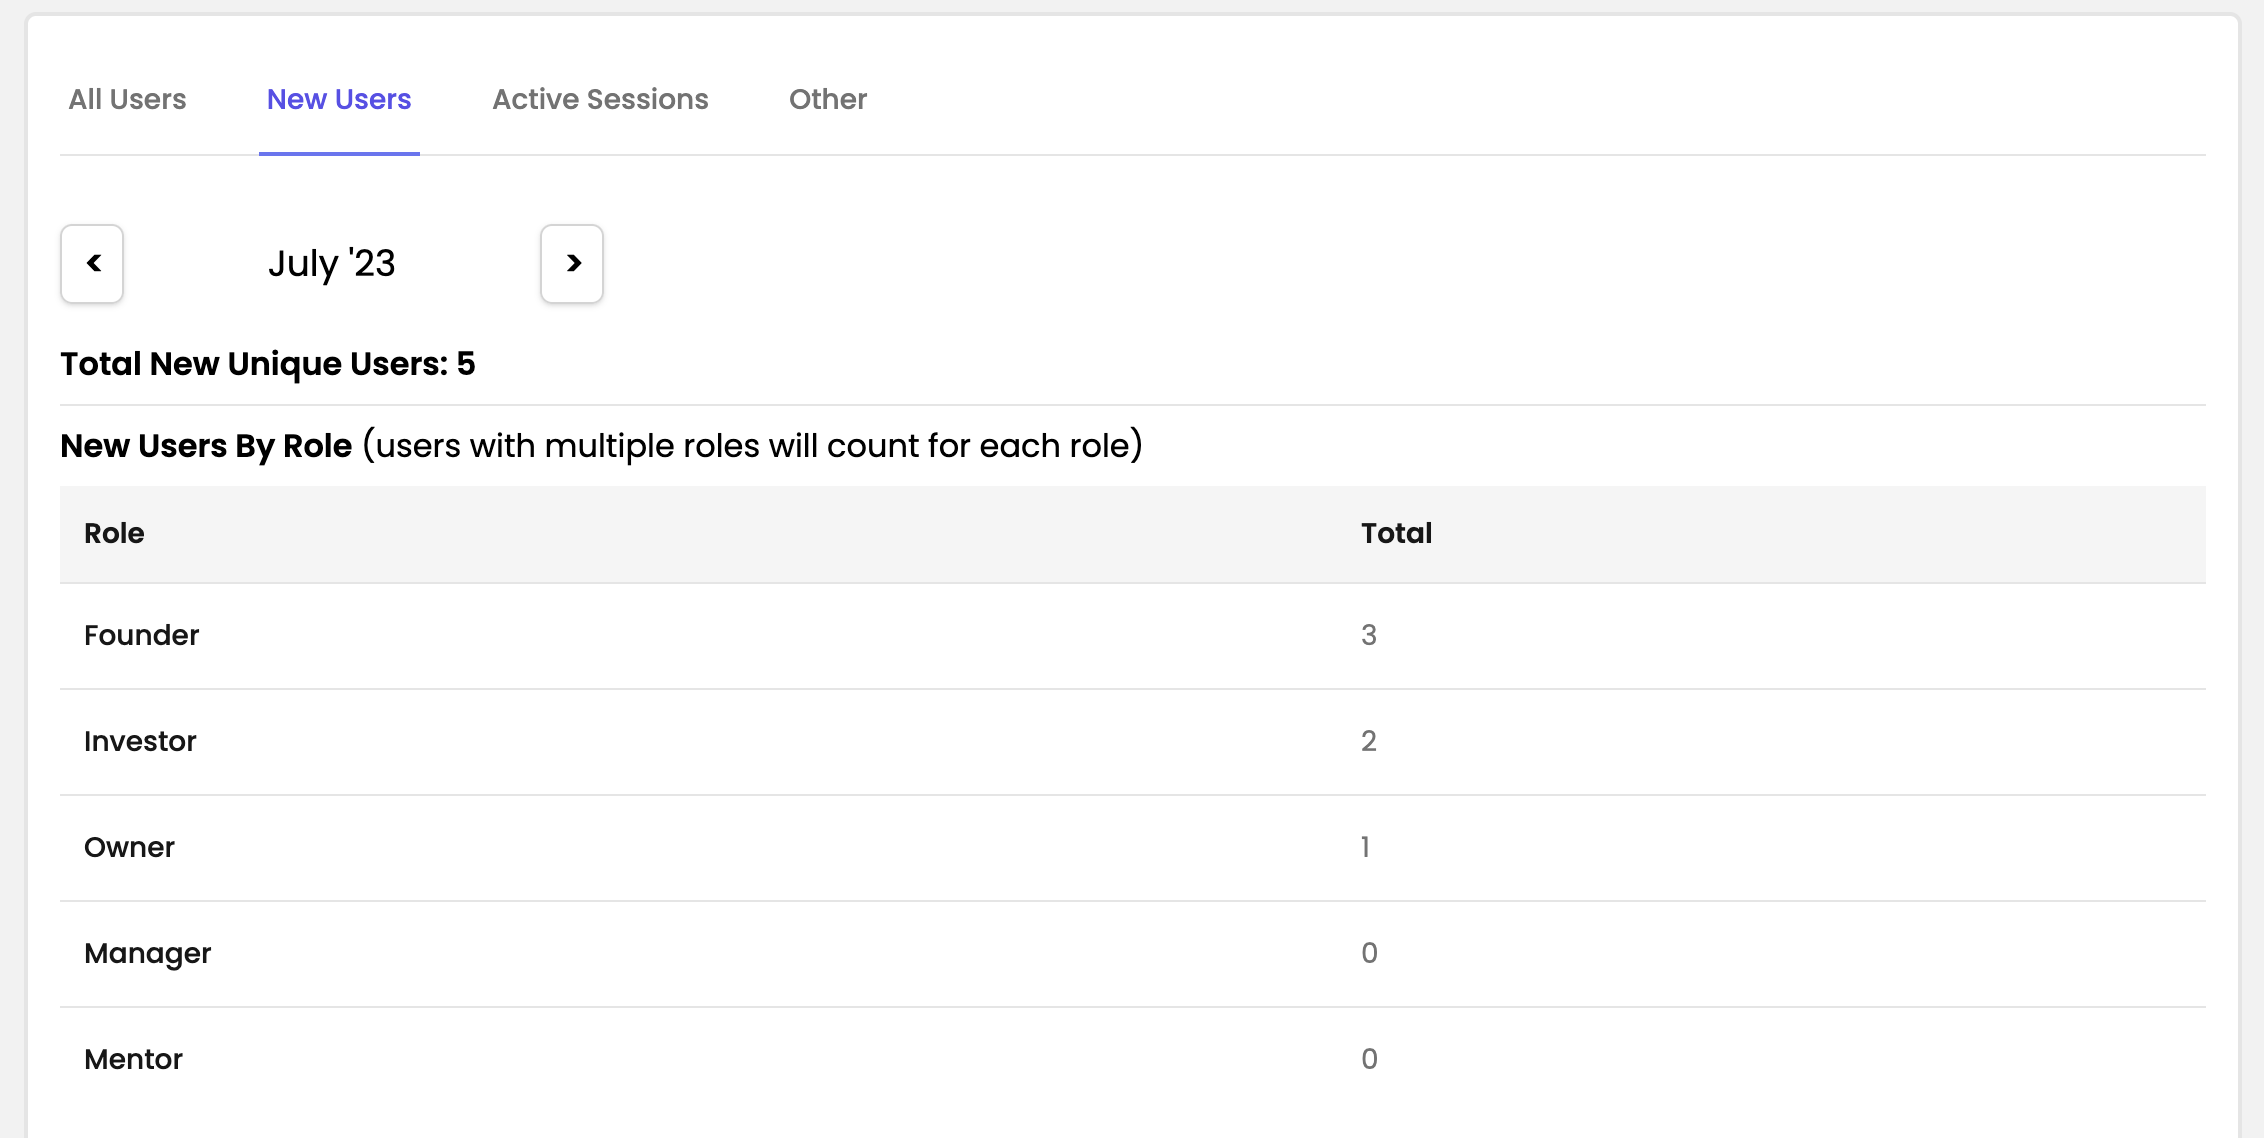
- New Users: shows newly added users (total and by role) for the selected month.
- Note: if the current month is selected, data is current for the previous day. Because a single user can hold more than one role, the sum of users by role, and user percentage by role may exceed the total user count.
- Note: if the current month is selected, data is current for the previous day. Because a single user can hold more than one role, the sum of users by role, and user percentage by role may exceed the total user count.
- Active Sessions: shows how many users, by role, took any action on your portal. This is currently limited to aggregate total. Coming soon: select Active Sessions by month.

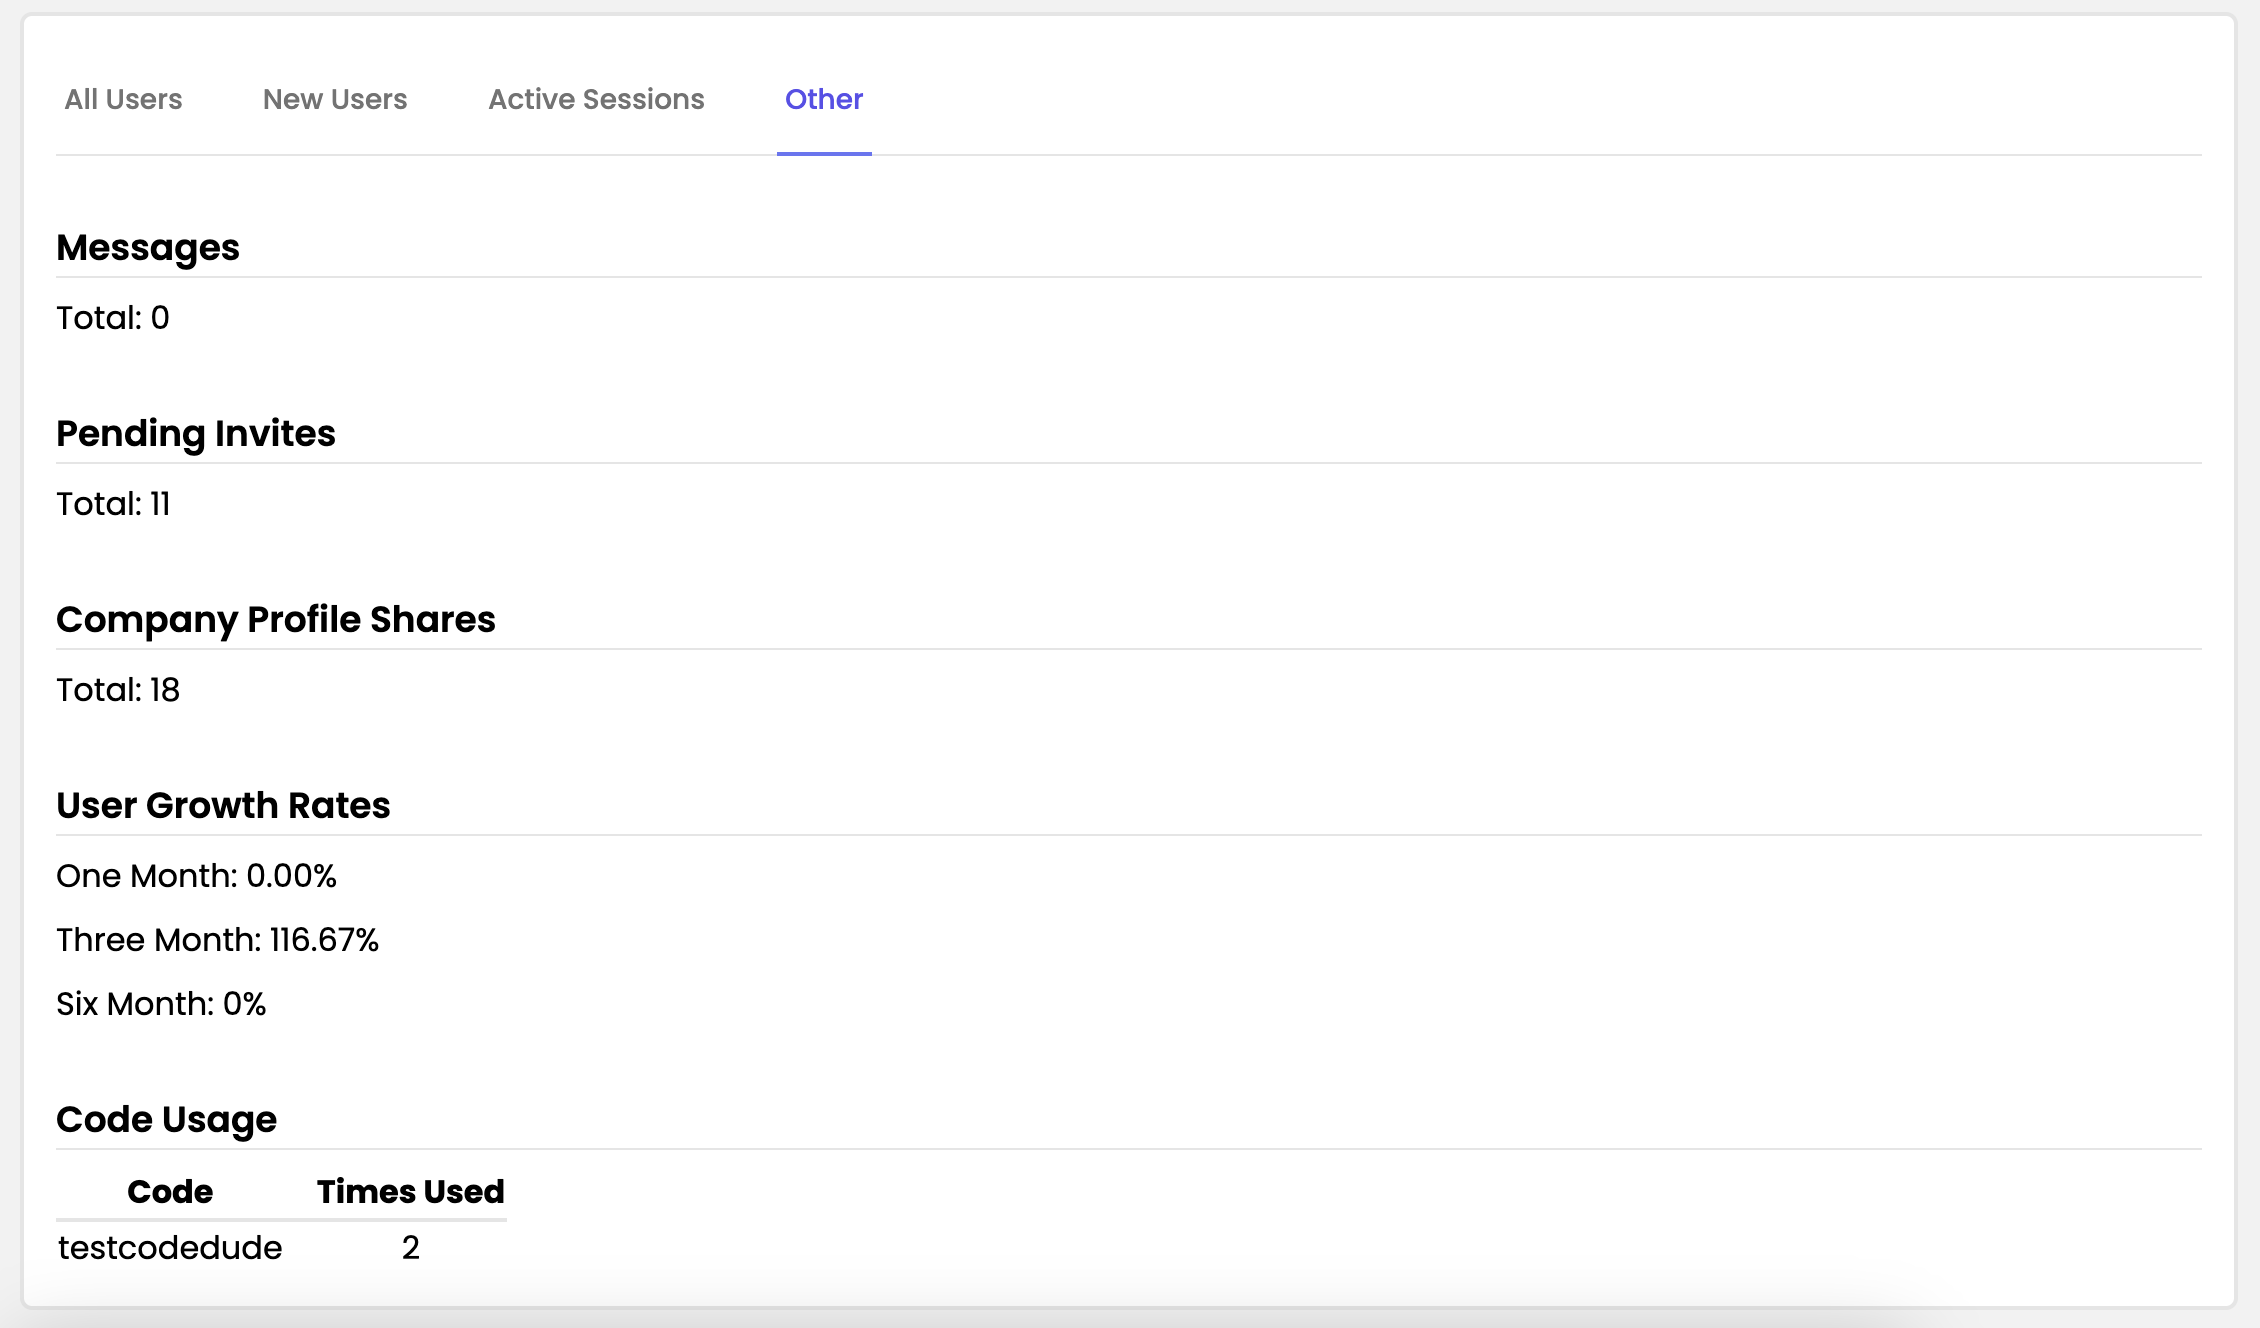
- Other: shows other aggregate portal engagement data
- Messages: how many total messages have been sent on your portal
- Pending Invites: how many users who were added by admins to the Members Table have not completed their account creation
- Company Profile Shares: how many times your users have shared their Company Profile by using the Share Profile function on their Company Profile page
- User Growth Rates: shows 1, 3, and 6 month user growth rate, in percentage.
- Code Usage: shows how many times any referral code had been used during the sign-up process.
- All Users: shows the current aggregate total users on your portal with a further breakdown by role and the total percentage of users by role.
- Portal Revenue: shows your monthly revenue share, by product. Click the links to learn more about how to setup your revenue sharing profile, and using the Portal Revenue analytics page.
English